Few things a business owner has to go through are as scrutinous and unpleasant as a data privacy audit.
In Germany, this might include a state commissioner for data protection putting your company’s data processing and storage practices under the microscope. Luckily, as it turns out, most of the time you’ll already be doing the right thing. Salting user passwords, allowing customers to delete their account, and allowing users to request all personal data that’s being stored about them should be business as usual for most of us.
There’s one thing that always poses a problem in a data privacy audit: the common reliance on US-American service providers for cloud services, data storage, and web analytics. This includes Google Analytics.
What does Google Analytics do? Google Analytics pervasively tracks your website and app users, understand what they like, how they convert, and what their business value to you is.
How’s this problematic? Using Google Analytics in Germany and other EU countries is legally questionable. I was personally told by a city official last year that to adhere to German privacy laws, you need to close a legal agreement with Google Ireland that guarantees you processing and storage of user data in conformity with the law. There exist countless templates for this and you can just mail this over to Google Ireland and get it counter-signed. Still, that’s not the end of the story.
When you think about it, you are handing over your user’s precious trust to a faceless multinational corporation that has a well-documented track record of not caring too much about their user’s privacy or third party information that they have been entrusted with. And if you ever want to migrate away from their platform, there is no easy way to retrieve all your customer data and move it someplace else. Choosing Google Analytics is a convenient thing to do, but it only gets you to your goal half-way.
Another big limitation is of course the quality of results when deploying Google Analytics on high-traffic pages. Sampling starts at around 500,000 records, meaning that when you are investigating small user segments, you don’t always get the full picture. More about their approach to sampling is described in this article by Moz.
I have spent the last few weeks trying to understand all the alternative
solutions to web analytics out there on the market, both proprietary and open
source. One of the most prominent alternatives is of course good old
Matomo (formerly Piwik) that you can self-host. It’s
unfortunate though that Matomo is hard to deploy outside of
LAMP
environments. It runs on PHP, assumes you have a normal HTTP server like Apache
running. I found that Matomo doesn’t like to be dockerized.
It’s also tied to a MySQL database, which surprises me. Given the size of the project I would have expected Matomo to have a flexible storage backend that can use any available SQL database. Since I am a self-proclaimed PostgreSQL fanboy, I would of course like for that database to be PostgreSQL. Attempts at putting Matomo inside a Docker container exist out there, but none of them strike me as easy to deploy solutions. Matomo itself doesn’t officially maintain a Docker contain ready to be deployed.
While 10 years ago a reliance on LAMP would have been totally acceptable, I
feel like in 2018 I just can’t deal with it anymore. We live in an age of
containers, reproducible deployments and many more luxuries that many of us
have gotten accustomed to.
I was thinking what every programmer at some point must have thought: What if I implemented it myself?
Yet, if creating something like Matomo takes a decade, how can you replicate that a solo developer? Isn’t that just classic Not Invented Here Syndrome?
Or, another take on this could be the following: sure, Matomo or Google Analytics can do a lot of things. Yet, what I need is only feature X, and perhaps feature Y. And as long as I choose my solution to be modular and flexible enough, I can add the rest when I need it. I am reinventing the wheel, but only to the point where it starts spinning.
1. Anatomy of an analytics platform
What exactly is it, that Google Analytics does? Analytics platforms contain these 3 major architecture components:
- Beacon: A small pluggable piece of JavaScript or tracking pixel that tracks page views and other interactions with a page.
- Storage: A program that stores each tracked interaction in a database.
- Dashboard: A web or desktop app with which you can look at user interactions, combine and filter them, segment by user characteristics, and generate sharable reports.
If we reduce our project to just these three components, we lower the necessary effort. For the sake of simplicity, we write it using the micro-framework Flask. With Flask we can create the beacon and storage component without needing to write a lot of boilerplate code.
2. Beacon
For a beacon, we need to provide an HTTP endpoint that accepts requests coming from a user’s browser. These requests contain detailed information on what site the user visited just now and other data about this interaction like browser language and screen dimensions.
We can either choose to add a small piece of JavaScript that contacts this HTTP endpoint. Or, we can add a small image tag to the end of a page. For the image that we serve we can either serve a real picture, like a 1×1 pixel Graphics Interchange Format (GIF) file. We can also serve up empty content with a 204 No Content HTTP Status code.
We get out the good old Flask and start hacking away. All we’re looking to do is to create a beacon endpoint that can
- Serve an empty response, and
- Track the request to a database, in this case using SQLite.
Note (2024-12-28): the below www.whatismyreferer.com service has
disappeared.
It’s important to keep in mind that we have to use the HTTP Referrer address
here, since the HTTP path used to retrieve the beacon doesn’t tell us what page
the user visited, but with a Referrer address, we can see on which page the
tracking beacon was requested. This page is exactly the page that the user’s
browser is displaying. To illustrate this, I show a simple
curl request to the handy site
https://www.whatismyreferer.com, once with referrer, and once without a
referrer. The referrer is http://www.google.com/.
Fun fact: the HTTP protocol RFC spells the referrer Header tag Referer.
%%bash
curl 'https://www.whatismyreferer.com/' \
    -H 'Referer: http://www.google.com/' 2> /dev/null \
    | grep -e 'Your HTTP' -A 5
Output:
		Your HTTP referer:
	</h2>
	<p class="lead" itemprop="description">
		<div class="alert alert-info" role="alert">
		<strong>
		http://www.google.com/		</strong>
%%bash
curl 'https://www.whatismyreferer.com/' \
    -H 'Referer:' 2> /dev/null \
    | grep -e 'Your HTTP' -A 5
Output:
		Your HTTP referer:
	</h2>
	<p class="lead" itemprop="description">
		<div class="alert alert-info" role="alert">
		<strong>
		No referer / hidden		</strong>
We can see that by adding the referrer header, WhatIsMyBrowser.com’s
What is my referrer? knows what our referrer
is.
3. Storage
Now, we create the database used to track page views. The only table we need is
called beacon_hit and it stores individual hits of our beacon, which in turn
are page views. It contains the following columns:
id: Primary key,timestamp: Time and date of page view, andurl: address visited.
Of course in the real world we would track a lot of information on top of that, but for the sake of example we keep it brief.
import os
import sqlite3

db_path = "/tmp/analytics-beacon.db"
# Ensure we start with a fresh database
os.remove(db_path)

conn = sqlite3.connect(db_path)

conn.execute("""
CREATE TABLE beacon_hit (
    id INTEGER PRIMARY KEY,
    timestamp TEXT,
    url TEXT
)
""")
conn.commit()
When the browser hits this beacon, Flask adds the following information to the
beacon_hit table:
id |
timestamp |
url |
|---|---|---|
| 1 | 2018-03-09T18:28:10.357074 | http://localhost:8000/ |
4. Beacon, continued
We can now create the tracking endpoint that stores page views to the database and serves an empty response. As described in section 2., it needs to respond to every request with 204 No Content. We can do that in Flask by just serving a response tuple containing
("", 204)
and we can call it a day. Let’s combine those two requirements in the following
track() function. First, we need to import Flask and create an app object.
Then, we can define the API endpoint.
from datetime import datetime  # for timestamp creation
from flask import (
    Flask,
    request,
)

app = Flask(__name__)

@app.route("/")
def track():
    conn.execute(
        "INSERT INTO beacon_hit (timestamp, url) VALUES (?, ?)",
        (
            datetime.now().isoformat(),
            request.referrer,
        ),
    )
    return "", 204
We can use Flask’s test client to then call the beacon and trigger a row to be created in our database.
app.test_client().get(
    "/",
    headers={"Referer": "http://localhost:8000/"},
)
Output:
<Response streamed [204 NO CONTENT]>
As expected, the result is a happy 204 No Content. We can then print out what the database has stored:
for row in conn.execute("SELECT * FROM beacon_hit"):
    print(row)
Output:
(1, '2018-03-09T20:16:17.045070', 'http://localhost:8000/')
Since we want to show some dashboard data later on, we fire off another 200
test requests. We visit two pages, page_a and page_b, 100 times each.
for _ in range(100):
    app.test_client().get(
        "/",
        headers={
            "Referer": "http://localhost:8000/page_a",
        },
    )
    app.test_client().get(
        "/",
        headers={
            "Referer": "http://localhost:8000/page_b",
        },
    )
5. Dashboard
Here, we try to get things done without spending too much time on implementation. We use Pandas to read in the data and create some plots. Our goal is to
- create a histogram showing which page by address is the most popular, and
- how requests are distributed over time.
We import Pandas and get started:
import pandas as pd
We read in the whole beacon_hit table as a Pandas DataFrame using
pandas.read_sql.
.
df = pd.read_sql(
    "select * from beacon_hit",
    conn,
    index_col='id',  # Automatically use the table's id column as our index
)
# Cast the timestamp to a proper datetime column in Pandas
df.timestamp = pd.to_datetime(df.timestamp)
Let’s take a quick look at the data contained in the table and now read in as a DataFrame:
df.head(5)
Output:
id |
timestamp |
url |
|---|---|---|
| 1 | 2018-03-09 20:16:17.045070 | http://localhost:8000/ |
| 2 | 2018-03-09 20:16:17.089820 | http://localhost:8000/page_a |
| 3 | 2018-03-09 20:16:17.091435 | http://localhost:8000/page_b |
| 4 | 2018-03-09 20:16:17.092620 | http://localhost:8000/page_a |
| 5 | 2018-03-09 20:16:17.093510 | http://localhost:8000/page_b |
That looks good. Let’s now plot page popularity using a simple Pandas value
count on the url column.
%matplotlib inline
df.url.value_counts().plot(
    kind="bar",
    rot=0,
    figsize=(10, 5),
    grid=True,
);
Output:
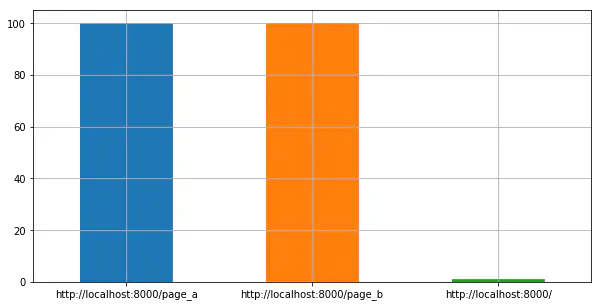
Bar chart showing hit counts for each page
We can see that /page_a and /page_b are equally popular with our Flask test
client.
To show request distribution over time, we have to be a bit clever since our
test data has timestamps that are close. That’s why we use a Pandas Grouper to
group the rows by milliseconds using pd.Grouper(freq='ms').
counts = df.groupby(
    pd.Grouper(key='timestamp', freq='ms'),
).count()
counts.tail()
Output:
timestamp |
url |
|---|---|
| 2018-03-09 20:16:17.283 | 0 |
| 2018-03-09 20:16:17.284 | 1 |
| 2018-03-09 20:16:17.285 | 1 |
| 2018-03-09 20:16:17.286 | 1 |
| 2018-03-09 20:16:17.287 | 1 |
That’s good enough for our purposes and we can simply plot the data:
counts.plot(figsize=(20, 10));
Output:
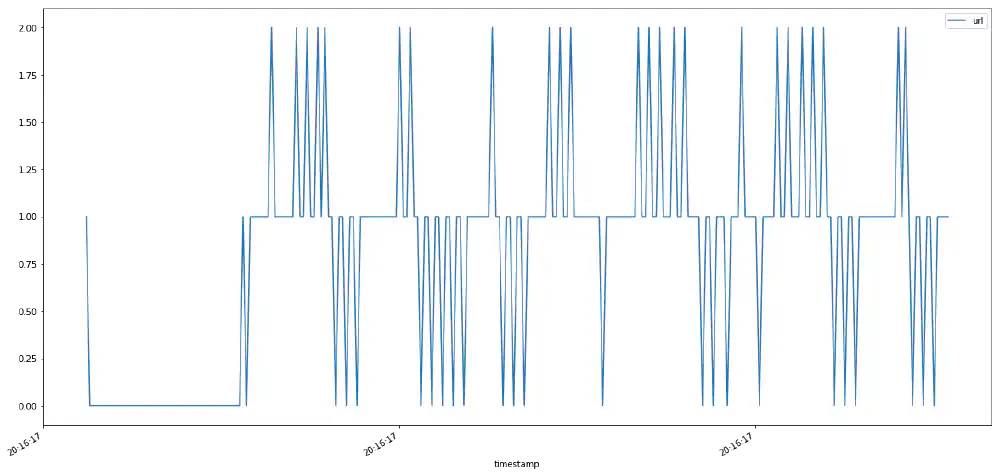
Plot showing hits per millisecond Open in new tab (full image size 18 KiB)
6. Wrap up
What was our initial goal? To find out what the smallest amount of moving parts required to host your own analytics solution is. We were able to condense this to three parts. Two of those I have made Open Source and available as Francis Beacon. I am happy that it’s possible to create your own analytics solution. Especially in Data Science, the more power you have over the data source, the better your results are going to be.